
The financial markets of January 2026 have entered a unique phase defined by what analysts call “High-Octane Instability.” Following a three-year bull run that has pushed the S&P 500 up nearly 90% since late 2022, investors are now navigating a landscape of record market concentration and a “winner-takes-all” AI supercycle. In this high-stakes environment, relying on lagging indicators or static valuations is no longer sufficient. Consequently, mastering SPX price action for tactical trading has become the primary differentiator for those looking to outperform the benchmark.
As we cross the threshold of 2026, the S&P 500 (SPX) continues to serve as the global barometer for equity health. However, with the index trading at a rich 22.2 times forward earnings—a level historically seen only during the dot-com bubble and the 2020 pandemic—the margin for error has vanished. Tactical traders are increasingly ignoring the “noise” of contradictory headlines and focusing instead on the raw, unfiltered data of price movements. Understanding SPX price action for tactical trading allows you to identify institutional footprints and sentiment shifts before they manifest in quarterly earnings reports.
The Governance of Price in a 2026 Market
Price action is the study of a security’s movement over time. In the 2026 market, where algorithmic agents and AI-driven liquidity dominate, price is the only truly leading indicator. While fundamental analysis tells you what should happen over the long term, price action tells you what is happening right now. For tactical traders, this distinction is the difference between a successful entry and a costly drawdown.
Understanding Support and Resistance in a High-Concentration Market
One of the defining features of 2026 is the extreme concentration of the S&P 500, with the top 10 companies representing roughly 40% of the index’s total market capitalization. This concentration means that SPX price action for tactical trading is heavily influenced by the “hyperscalers”—Microsoft, Alphabet, Amazon, Meta, and Oracle.
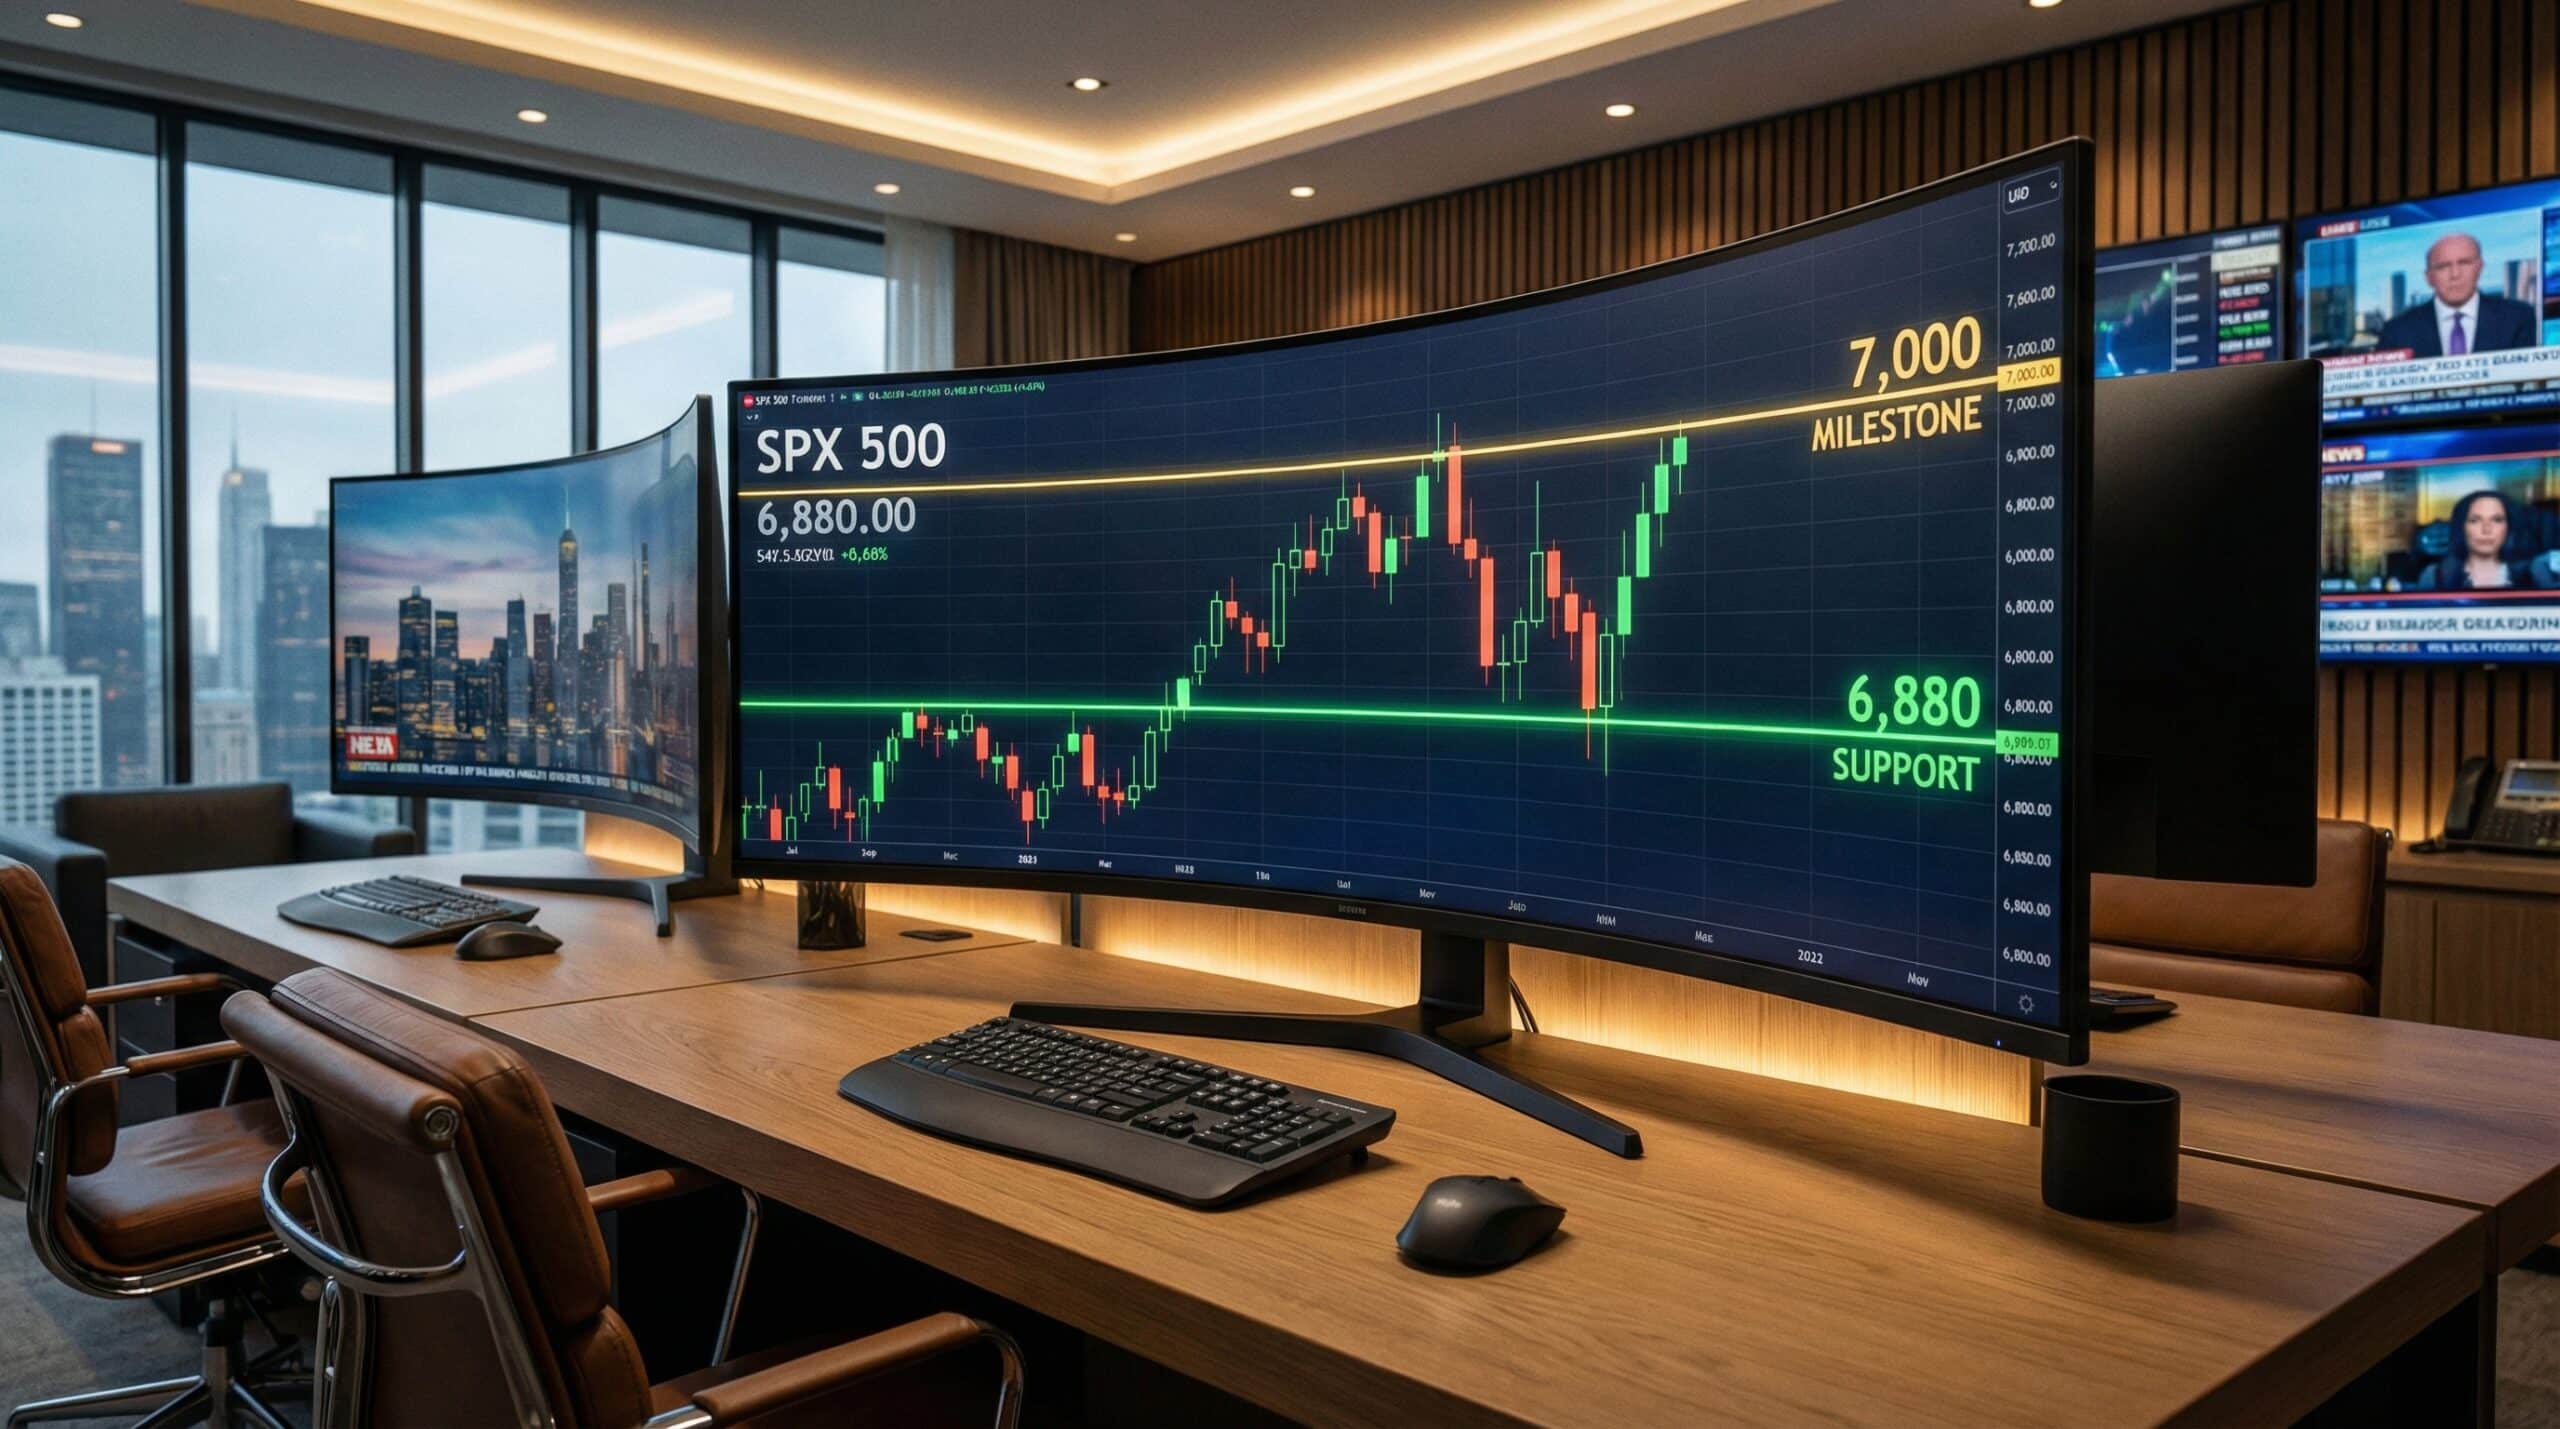
Tactical traders must monitor key levels with precision. For instance, the 6,880 level has transitioned from a stubborn resistance point in late 2025 to a “fortress” support level in early 2026. If the index remains range-bound between 6,880 and 6,985, the price action suggests a period of healthy consolidation. However, a decisive break below 6,880 would likely signal a deeper pullback toward the 6,830 mark, fueled by profit-taking in over-extended tech segments.
The Role of AI Agents in Decoding Price Signals
In 2026, the “untold strategy” used by elite traders involves leveraging AI agents to filter price action “noise.” Because the market is now “unstable” rather than merely “uncertain,” rapid rotations between sectors occur weekly. AI models help traders identify “Rejection Candles” and “Inside Bars” across the 500 components of the index in real-time.
By grounding your SPX price action for tactical trading in these high-frequency signals, you can detect when institutional money is quietly rotating out of “expensive” tech and into “undervalued” healthcare or cyclical sectors. This “Style Alpha” is essential for surviving the high P/E environment of 2026, where a single earnings disappointment from a market leader can trigger a 200-point swing in the index.
Practical Strategies for Navigating 2026 Volatility
To profit from the current market, you must move beyond passive indexing. The 2026 economic environment—characterized by front-loaded fiscal stimulus and a “One Big Beautiful Bill Act” (OBBBA) tax tailwind—requires a tactical framework that can adapt to rapid sentiment shifts.
The Breakout Entry Strategy for the 7,000 Milestone
As the SPX nears the psychological milestone of 7,000, “Breakout Entries” are the most effective way to capture momentum. In a breakout strategy, you wait for the price to close decisively above a defined resistance level, such as the current 6,985 ceiling.
writing a financial plan with ChatGPT
The Step-by-Step Breakout Framework:
- Identify the Range: In early 2026, the SPX has been range-bound between 6,880 and 6,985.
- Wait for the Close: Do not enter on an intraday spike. Wait for a “Daily Candle” to close above 6,985 with volume that exceeds the 20-day average.
- Confirm with the VIX/VXV Ratio: Check the volatility structure. A low VIX/VXV ratio suggests that investors are not yet fearful, providing a “green light” for the breakout.
- Set the Stop-Loss: Place your protective stop-loss just inside the broken resistance level (around 6,970).
- Target the Extension: Historically, a breakout from a 100-point range targets a move equal to the width of the range, putting the 2026 target at 7,085.
The Rejection Candle Strategy at 22x P/E
Given the “stretched” valuations of 2026, many traders are using “Rejection Candles” (Pin Bars) to identify local tops. A bearish pin bar—a candle with a long upper wick and a small body—at a major resistance level tells you that the market is rejecting higher prices.
Actionable Steps for Risk Management:
- Monitor VIX Spikes: In 2026, a VIX jump above 20 often precedes a 5% “sentiment shock” in the SPX.
- Audit Sector Relative Strength: Use a “Relative Strength Index” (RSI) to see if the SPX is being carried only by tech. If tech is rising but the “Equal Weight” S&P 500 is falling, the price action is “divergent” and risky.
- Utilize Trailing Stops: With the SPX at all-time highs, use a 3% trailing stop-loss to protect your gains from a “midterm election year” correction.
- Watch the 10-Year Treasury: If yields rebound above 4.5% in late 2026, expect immediate downward pressure on SPX price action.
2026 Market Scenarios and Case Insights
To understand the value of SPX price action for tactical trading, let’s look at the projected path for the index through the remainder of the year. While Wall Street remains bullish, with a median 2026 year-end target of 7,600, the path will be anything but linear.
Scenario: The “Midterm Correction” of 2026
Historically, the S&P 500 experiences an average 18% peak-to-trough decline during midterm election years due to policy uncertainty. In early 2026, the market is pricing in a 35% probability of a U.S. recession. If the price action breaks below the 6,830 support, tactical traders should pivot to a defensive stance.
| SPX Level | Market Signal | Tactical Action |
| 7,196 | Over-Extended (Bull Case) | Trim positions / Sell Covered Calls |
| 6,985 | Major Resistance | Watch for Breakout or Rejection |
| 6,880 | Primary Support | Add to “Quality” positions if it holds |
| 6,830 | Critical Breakdown | Exit “Beta” / Increase Cash Reserves |
The “Winner-Takes-All” Divergence
In the first half of 2026, we are seeing a record divergence between the “Big Tech” leaders and the rest of the market. According to recent data from Citi Wealth, while the S&P 500 has double-digit earnings growth, many small-cap indices still have negative net margins. This makes SPX price action for tactical trading even more critical; you must ensure your exposure is concentrated in the “Alpha” names that are actually driving the index higher.
As J.P. Morgan Global Research notes, the AI supercycle is expected to drive above-trend earnings growth of 13–15% through 2027. However, if the price action begins to “decouple” from these fundamentals—meaning prices fall while earnings stay strong—it represents a “tactical buying opportunity” rather than a reason to panic.
Common Mistakes and Risks to Avoid
- Ignoring the P/E Multiple: Trading solely on patterns without realizing the SPX is at a 22x forward multiple (top decile of history).
- Chasing Hype over Structure: Entering a trade because of “AI Exuberance” when the price action is clearly showing “Lower Highs.”
- Neglecting the Labor Market: In 2026, the labor market is “the key.” If unemployment rises toward 4.6%, even strong AI capex won’t save the consumer-discretionary segments of the SPX.
- Over-Reliance on Seasonality: Assuming 2026 will be a “normal” year. With tariffs potentially adding 0.4–0.5 percentage points to core PCE inflation, the 2026 macro backdrop is “unstable.”
- Failing to Hedge: Not using SPX put options or “Inverse ETFs” when the price action breaks below major moving averages.
navigating the 2026 tax bracket adjustments
Conclusion – Key Takeaways & Next Steps
The journey of the S&P 500 in 2026 is a “climb up a wall of worry.” By focusing on SPX price action for tactical trading, you can strip away the noise of trade war concerns and election-year rhetoric to see the true direction of the world’s most important index. Whether you are playing the breakout toward 7,000 or defending the 6,880 support, your success depends on your ability to read the tape with clinical precision.
In summary, price is your most honest advisor. Reiterate your commitment to your strategy by setting your “Decision Authority” levels today.
Would you like me to help you analyze the “Relative Strength” of specific SPX sectors to see which is leading the current 2026 rally? Explore our further resources to stay updated on the latest wealth-building strategies and tactical insights.


2 Comments